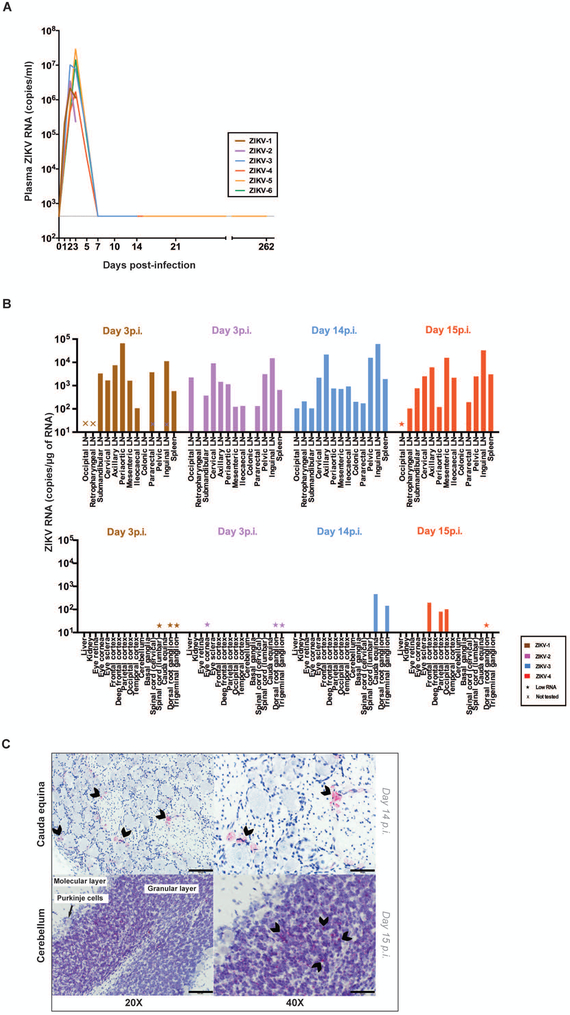
Figure 1. ZIKV RNA in blood and tissues.
(A) Plasma ZIKV RNA concentration as measured by RT-PCR. (B) Assessment of ZIKV RNA concentration by RT-PCR in lymphoid (top) and non-lymphoid tissues (bottom) at day 3 or 14-15 post-infection. Low RNA indicates < 20 ng/μl was run in the PCR. (C) Representative detection of ZIKV RNA by RNAscope in situ hybridization in nervous system tissues. Arrowheads indicate some of the most intense RNAscope signals (red). No arrowheads were placed on the bottom left panel as the RNAscope signal was diffusely positive in the cerebellum at this magnification. The scale bars represent 100μm and 50μm in the left and right panels, respectively. 4-5 images per brain area were examined.

