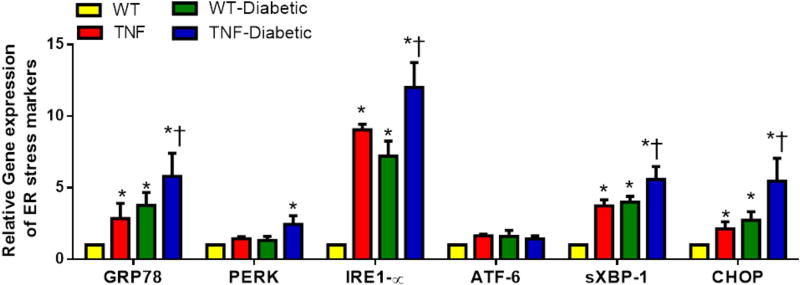
Fig 5. tie2-TNF transgenic mice and the diabetic tie2-TNF mice demonstrate an increased gene expression of ER stress markers.
Assessment of gene expression by Taqman qPCR and expressed as fold change normalized to internal control in the study groups. Data represent Mean ± SEM from n=3–5 animals. *p<0.05 compared to WT mice and † p<0.05 compared to tie2-TNF (TNF) mice.

