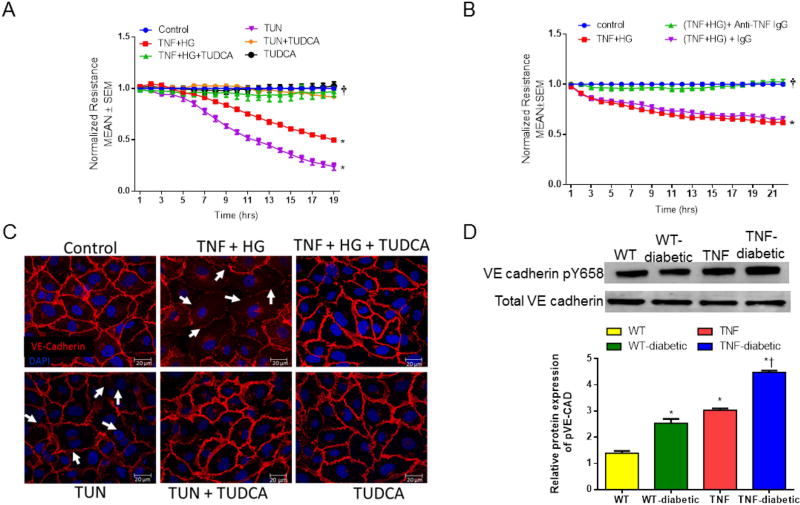
Fig 7. Trans-endothelial resistance is protected by ER stress inhibitor in vitro.
Representative ECIS tracings plotted as normalized resistance expressed as Mean ± SEM from TNF+HG with TUDCA (A) and TNF neutralizing antibody (B). Data represented from two independent experiments performed in duplicates. *p<0.05 compared to control and † p<0.05 compared to TNF+HG. (C) Representative confocal immunofluorescence images of VE-cadherin in HREC. White arrows indicate loss of cell-cell contacts. (D) Immunoblots of phospho-VE-cadherin and VE-Cadherin in the retina collected from the study groups. Data represent Mean ± SEM from n=3–5 animals, *p<0.05 compared to WT mice, † p<0.05 compared to tie2-TNF (TNF) mice.

