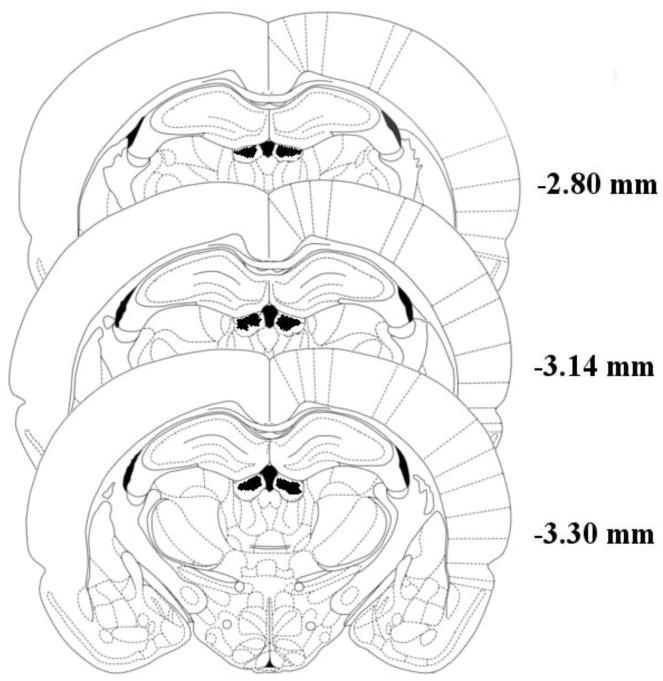
Figure 1.
Shaded areas indicate regions where successful cannula tip placements could be verified. Numbers represent distance of coronal slices posterior to bregma. Due to the volume of drug injected (0.5 μl/side) and the target region’s close proximity to the midline, the area affected likely includes a broad region of both the Lateral Habenula (LHb) and Medial Habenula (MHb). Figure adapted from Paxinos & Watson, 2005.

