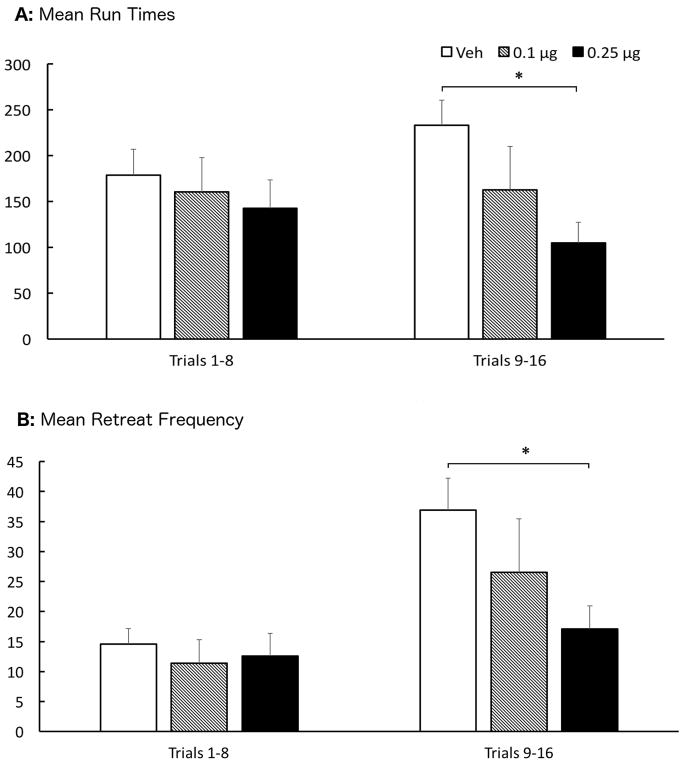
Figure 3.
Top Panel (A): Group Mean (±SEM) Total Run Times averaged over the first half (left) of trials and the last half (right) for animals treated with bilateral infusions of vehicle (Veh), 0.1μg or 0.25μg of CP 94,253 into the LHb. Bottom Panel (B): Group Mean (±SEM) retreat frequency summed over the first half and the last half of runway trials. *(p<.05) when compared to vehicle

