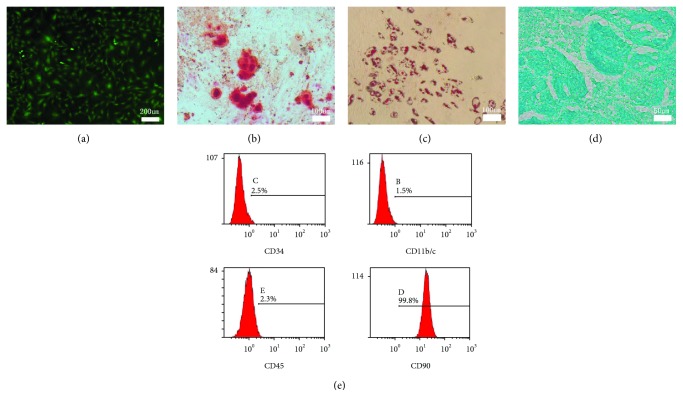
Figure 1.
Characterization of GFP BMSCs. (a) Morphology of P3 GFP BMSCs. (b) Alizarin red staining of BMSCs after osteogenic induction for 14 days. (c) Oil red staining of BMSCs after adipogenic induction for 10 days. (d) Alcian blue staining of BMSCs after chondrogenic induction for 20 days. (e) Representative results of flow cytometry analysis of P3 BMSCs indicating abundant expression of CD90 and the absence of CD 34, CD11b/c, and CD45.

