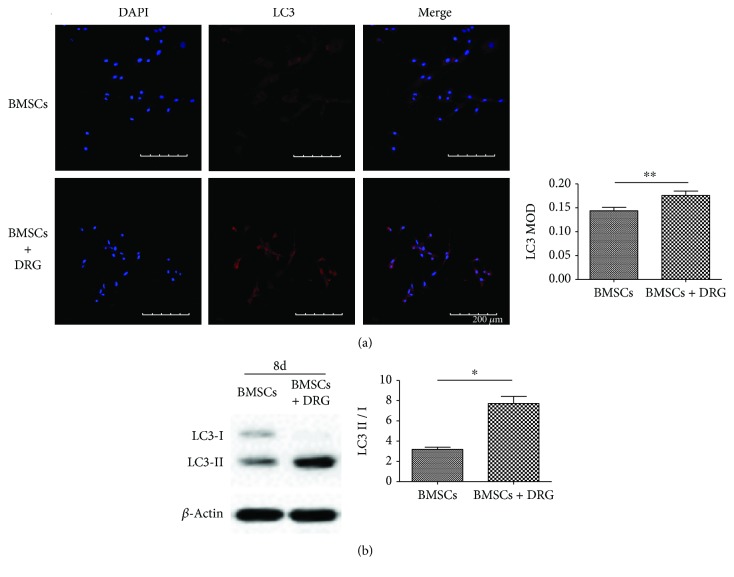
Figure 4.
Coculturing with DRG enhanced BMSCs autophagy. (a) LC3 immunofluorescence images after coculture for 8 days. (b) Western blot analysis of LC3II and LC3I and the LC3II/LC3I ratio analysis after coculture for 8 days. MOD: mean optical density. ∗ denotes that differences are statistically significant between BMSCs + DRG and BMSCs groups.

