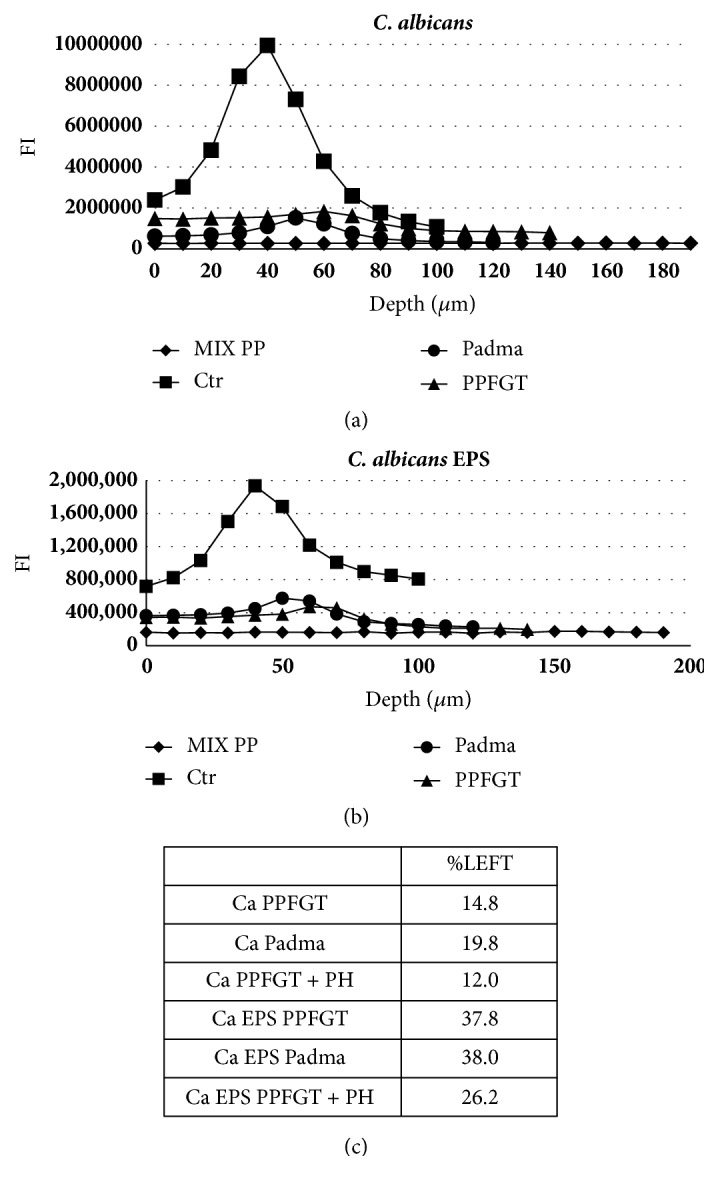
Figure 3.

Quantification of the confocal laser scanning microscopy results. Charts (a) + (b) show the fluorescence intensity (FI) in each layer of the biofilm depth. (a) Cells quantification of the control and the treated groups. (b) EPS quantification of the control and the treated groups. (c) A table summing up the percentage of cells and EPS left after the various treatments relative to the control.
