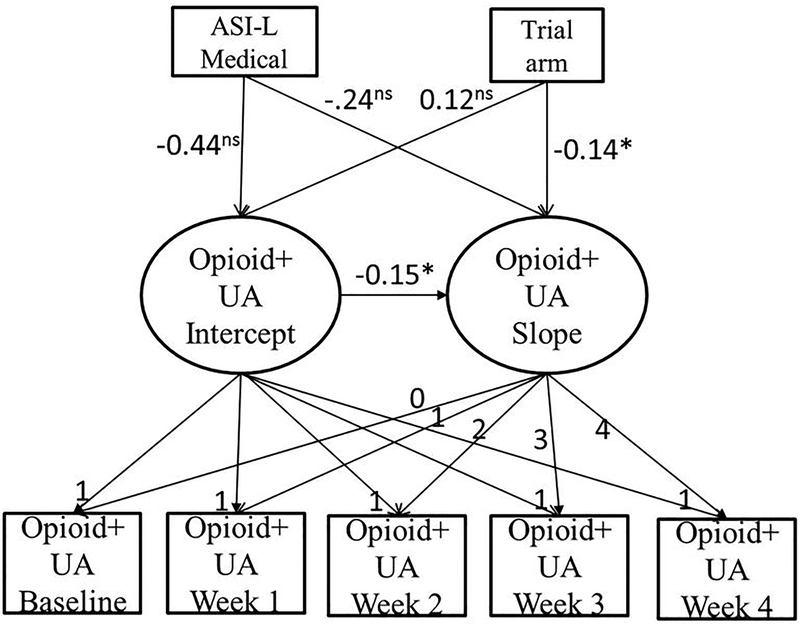
Figure 4.
Schematic representation or primary results of the linear latent growth model of opioid-positive urinalysis (opioid+UA) over time in a randomized clinical trial that compared buprenorphine/naloxone tapering strategies (7-day and 28-day) in the male sample. Unstandardized regression coefficients are reported. ASI-L = Addiction Severity Index-Lite; *p<.05; ns statistically non-significant.

