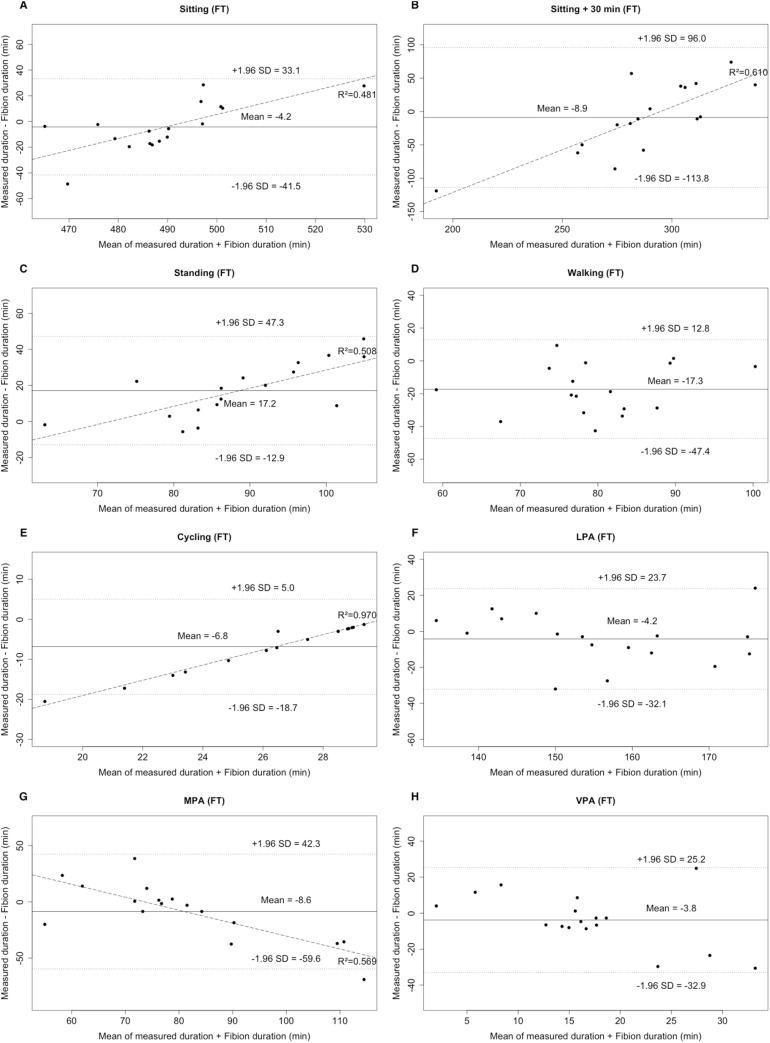
Figure 1. Bland–Altman plots for the duration of different PA types (A–E: sitting, long sitting, standing, walking, cycling) and intensities (F–H: LPA, MPA, VPA) for Fibion worn on the thigh (FT).
The middle line shows the mean difference between FT and criterion 1 and the dashed lines indicate the limits of agreement (±1.96 × SD of the different scores). Linear regression lines were fitted for proportional error.

