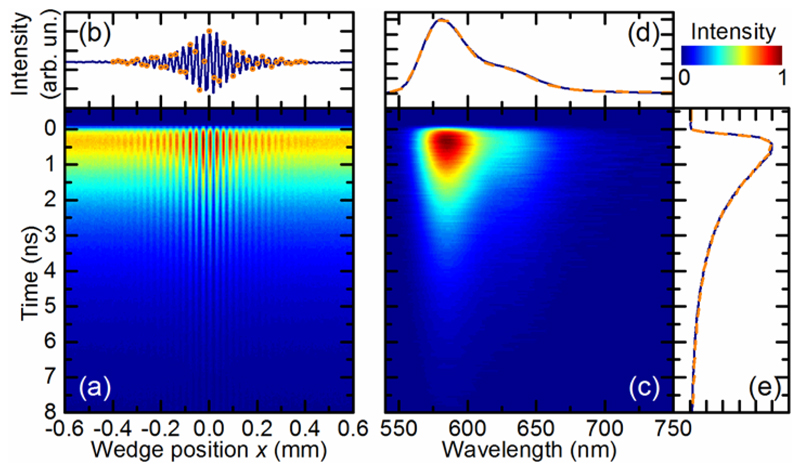
Fig. 2.
Time- and wavelength-resolved fluorescence signal of Rhodamine B dye in acetone solution. (a) 2D fluorescence map as a function of emission time and wedge position x of the interferometer. (b) In solid blue, the fluorescence interferogram as a function of x, obtained by integrating the map in (a) along the temporal axis. The orange circles indicate the undersampled interferogram composed of 40 data points. (c) Fluorescence as a function of detection wavelength and emission time, where the former is obtained by FT of (a). (d,e) Marginals of (c), obtained by integrating the map along the horizontal and vertical directions, respectively, showing the overall fluorescence spectrum and decay dynamics. The orange dashed and the blue solid curves are related to the complete and to the underdamped data set, respectively, and they agree very well.

