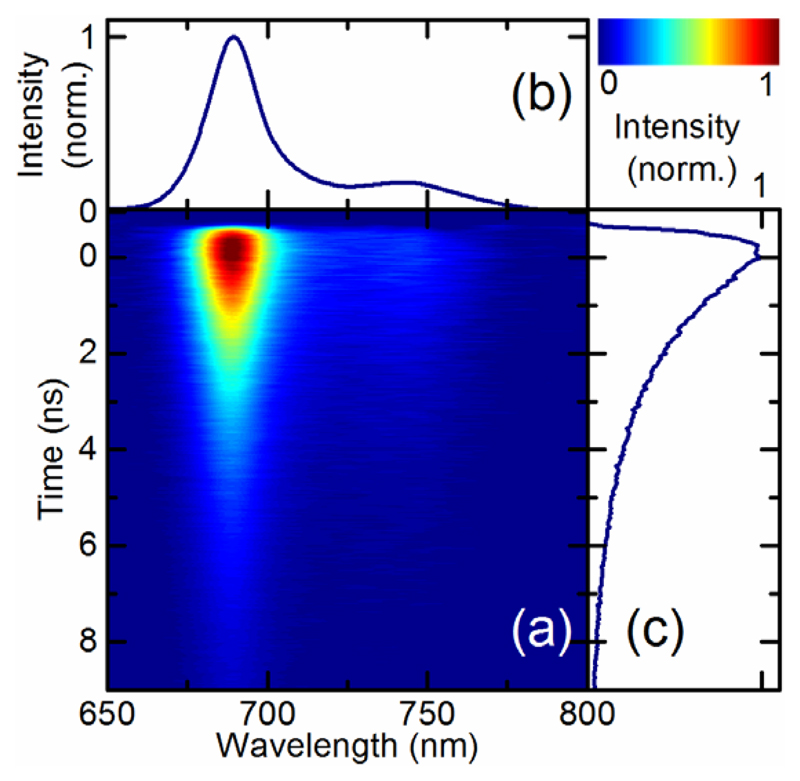
Fig. 4.
(a) Fluorescence map FL(λ,T) as a function of wavelength λ and decay time T for the LHCSR3 complex from C. reinhardtii; (b-c) Marginals of (a), obtained by integrating the map along the horizontal and vertical directions, respectively, showing the overall fluorescence spectrum and decay dynamics.

