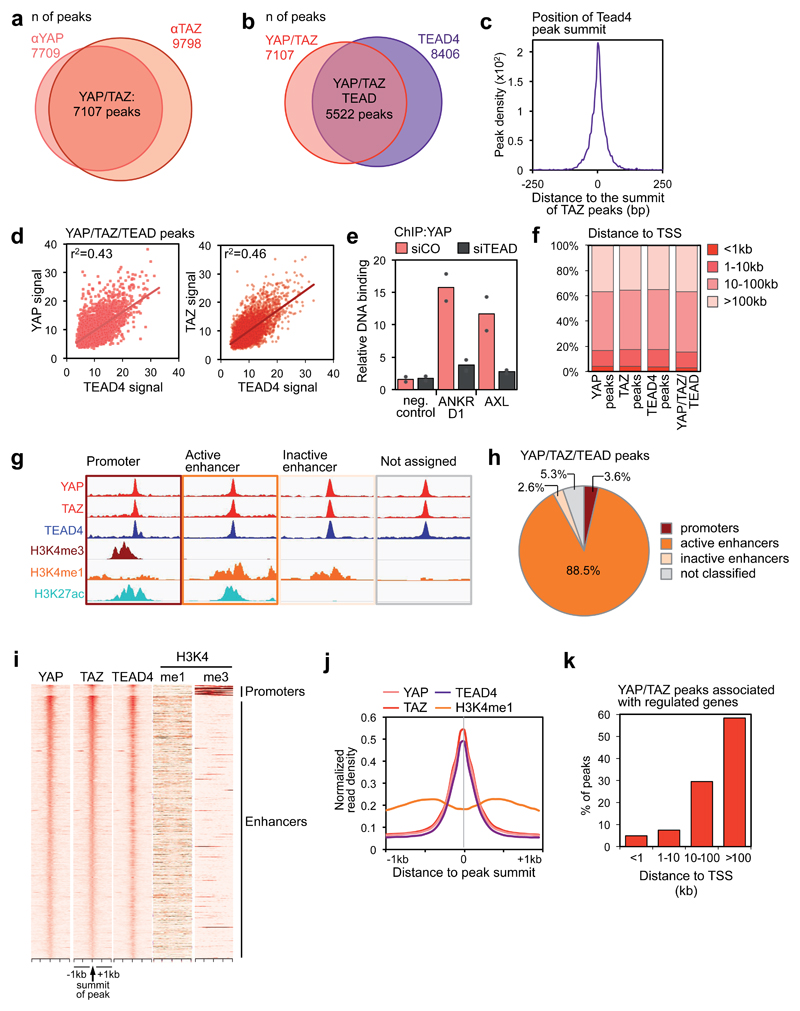
Figure 1. Genome-wide co-localization of YAP, TAZ and TEAD on enhancers.
(a) Overlap of peaks identified with YAP and TAZ antibodies. See Supplementary Figure 1a for specificity controls of the antibodies, and Table S1 for the results of de novo motif finding in YAP/TAZ peaks.
(b) Overlap of YAP/TAZ peaks and TEAD4 peaks. See Supplementary Figure 1g for specificity controls of TEAD4 antibody, and Supplementary Figure 1h for ChIP-seq profiles at positive control loci.
(c) Position of TEAD4 peak summits relative to the summits of the overlapping YAP/TAZ peaks, in a 500 bp window surrounding the summit of YAP/TAZ peaks.
(d) Linear correlation between the signal of YAP or TAZ and TEAD4 peaks in the 5522 shared binding sites. r2 is the coefficients of determination of the two correlations.
(e) ChIP-qPCR showing YAP binding to the indicated sites in MDA-MB-231 cells transfected with control (siCO) or TEAD siRNAs (siTEAD A). Relative DNA binding was calculated as fraction of input and normalized to IgG (IgG bars are omitted); data from 2 biological replicates from one representative experiment are shown.
(f) Absolute distance of YAP peaks (n=7709), TAZ peaks (n=9798), TEAD4 peaks (n=8406) or overlapping YAP/TAZ/TEAD peaks (n=5522) to the nearest TSS.
(g-h) Association of YAP/TAZ/TEAD peaks to promoters and enhancers according to ChIP-seq data for histone modifications. (g) Scheme illustrating peak classification. (h) Fraction of YAP/TAZ/TEAD peaks associated with each category. See Supplementary Figure 1j for validation of the enhancer/promoter status of a set of YAP/TAZ/TEAD-bound regions.
(i) Heatmap representing YAP/TAZ/TEAD binding sites located on promoters (top) and enhancers (bottom). YAP, TAZ and TEAD4 peaks are ranked from the strongest to weakest signal in TAZ ChIP, in a window of ±1kb centered on the summit of TAZ peaks. H3K4me1 and H3K4me3 signal in the corresponding genomic regions is shown on the right.
(j) Bimodal distribution of H3K4me1 signal around the summit of YAP/TAZ and TEAD4 peaks.
(k) Distance between YAP/TAZ/TEAD binding sites and the TSS of the direct target genes they are associated to. Overall, 635 peaks were associated to 379 genes positively regulated by YAP/TAZ.
See Methods for reproducibility of experiments.

