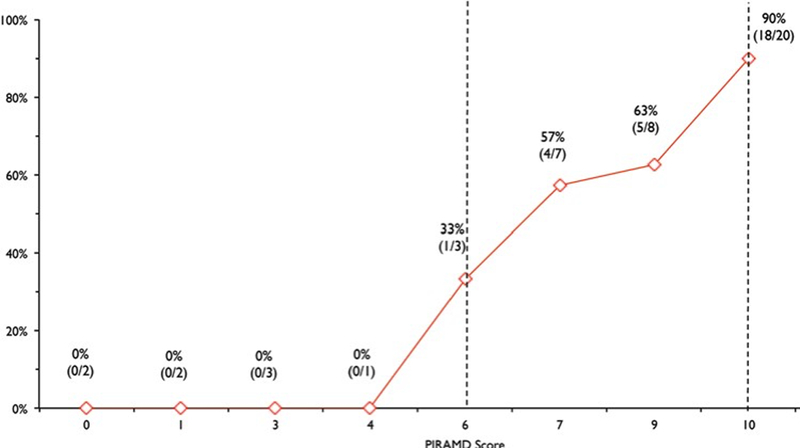
Figure 4.

Graph showing the PIRAMD grade versus proportion of patients who were symptomatic. Vertical dashed lines representPIRAMD Grade 2 (≥ 6) and Grade 3 (10) demarcations, respectively. Figure is available in color online only.

Graph showing the PIRAMD grade versus proportion of patients who were symptomatic. Vertical dashed lines representPIRAMD Grade 2 (≥ 6) and Grade 3 (10) demarcations, respectively. Figure is available in color online only.