
Figure 4.
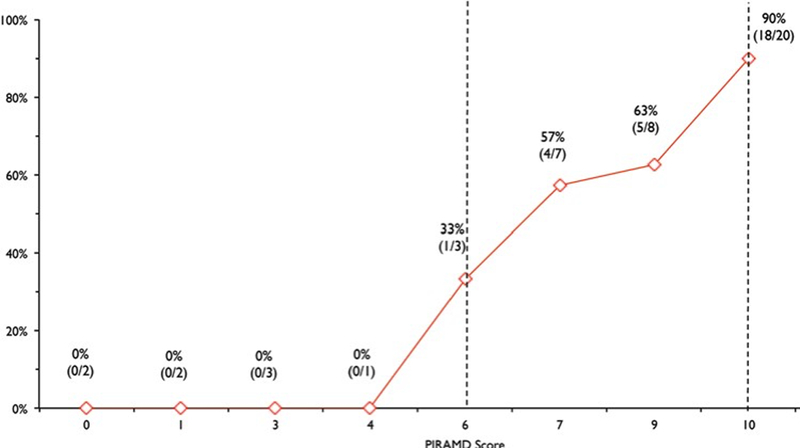
Graph showing the PIRAMD grade versus proportion of patients who were symptomatic. Vertical dashed lines representPIRAMD Grade 2 (≥ 6) and Grade 3 (10) demarcations, respectively. Figure is available in color online only.
Official websites use .gov
A
.gov website belongs to an official
government organization in the United States.
Secure .gov websites use HTTPS
A lock (
) or https:// means you've safely
connected to the .gov website. Share sensitive
information only on official, secure websites.
Graph showing the PIRAMD grade versus proportion of patients who were symptomatic. Vertical dashed lines representPIRAMD Grade 2 (≥ 6) and Grade 3 (10) demarcations, respectively. Figure is available in color online only.