Fig. 3.
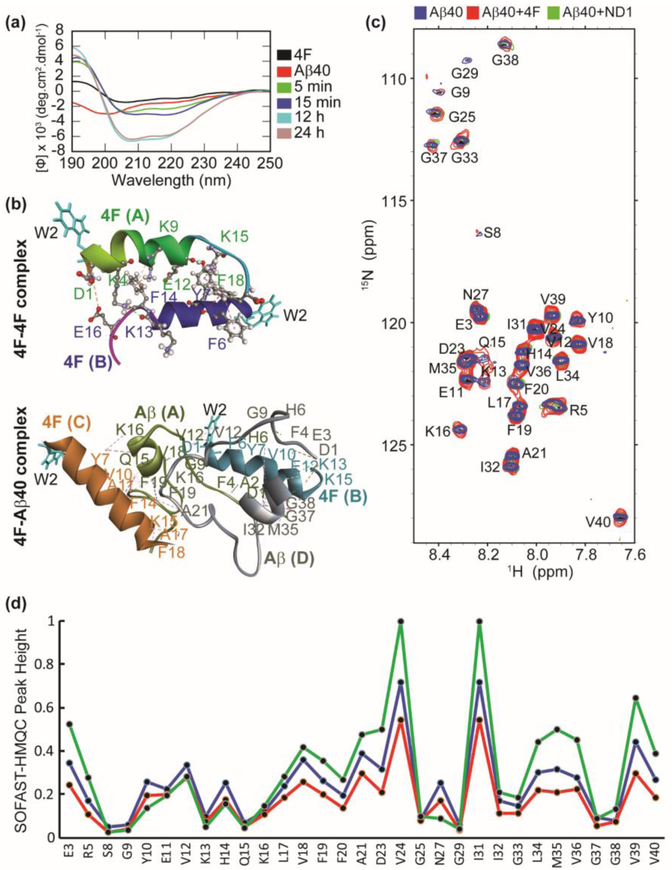
Atomistic insights into 4F Aβ40 interactions. (a) Far-UV CD spectra of 4F peptide (20 μM) titrated with Aβ40 (20 μM) measured at the indicated time-intervals. (b) MD snapshots showing the formation of 4F-homodimer and 4F-Aβ40 hetero tetramer. The solvent exposed Trp2 residues are shown in cyan color. The peptide chains are shown in cartoon and indicated in bold. The interacting amino acid residues are labeled and intermolecular hydrogen bonds are shown in dashed lines (see Tables S1 and S2). (c) 2D 1H/15N SOFAST-HMQC spectra of 50 μM Aβ40 (blue), 50 μM Aβ40 mixed with 50 μM 4F (red), and 50 μM Aβ40 mixed with 50 μM 4F of ND2 (green). The NMR spectra were recorded on a 600 MHz Bruker NMR spectrometer at 37°C and the samples were prepared in 10 mM sodium phosphate buffer, pH 7.4 containing 10% D2O. (d) Relative NMR signal intensities of Aβ40 residues measured from Fig. 3c.

