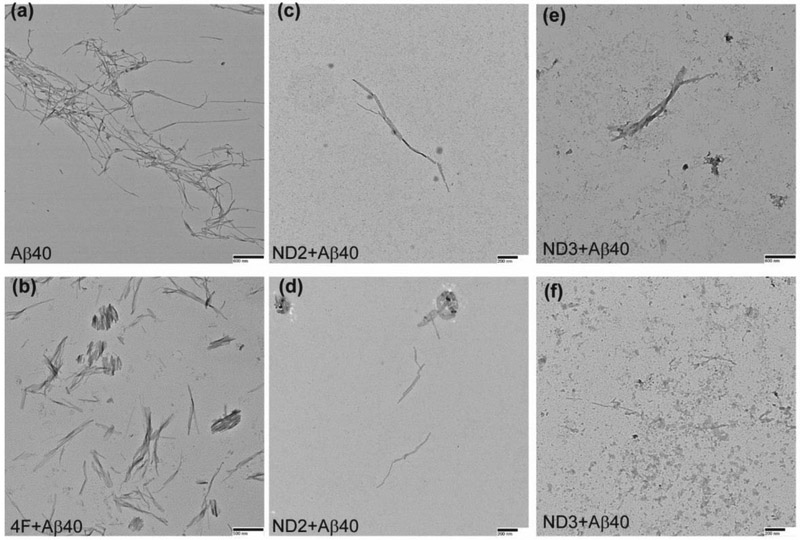
Fig. 6.
TEM images showing morphology of Aβ40 fibers in presence and absence of 4F peptide or 4F-peptide-lipid-nanodiscs. The samples analyzed by ThT based experiments (see Figure 1) are used for or TEM imaging. Aβ40 samples in absence of 4F or 4F-nanodiscs (a) and in presence of 4F (b), ND2 (c and d) and ND3 (e and f) were adsorbed on carbon-coated copper grids and negatively stained with 2% uranyl acetate for TEM imaging. Scale bars are shown on the bottom right. TEM image of nanodiscs is shown in Figure S10.

