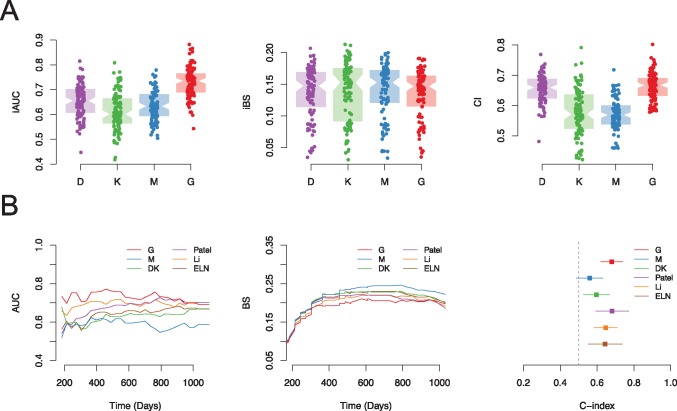
Figure 2.
Evaluation of the prognostic value of different data types. A) Prognostic value of different types of data (D, demographic; K, karyotypes; M, mutations; and G, genes) in the Clinseq data set, evaluated by 100-round cross-validation (CV), measured by integrated area under the curve (iAUC), integrated Brier score (iBS), and concordance index (C-index). In each round of CV, 80% of patients were randomly selected as the training set. The iAUC, iBS, and C-index were assessed in the rest of the patients predicted by the fitted model. Each dot in the boxplot represents the iAUC/iBS/C-index measured in one round of CV. B) Prognostic score validation in the The Cancer Genome Atlas–AML cohort, predicted by the Clinseq-DK, M, G models, compared with the reference model (the European LeukemiaNet, Patel’s model, and Li’s model) in terms of the AUC of time-dependent receiver operating characteristic curve, Brier score, and C-index. AUC = area under the curve; BS = Brier score; CI = confidence interval; ELN = European LeukemiaNet; iAUC = integrated area under the curve; iBS = integrated Brier score.

