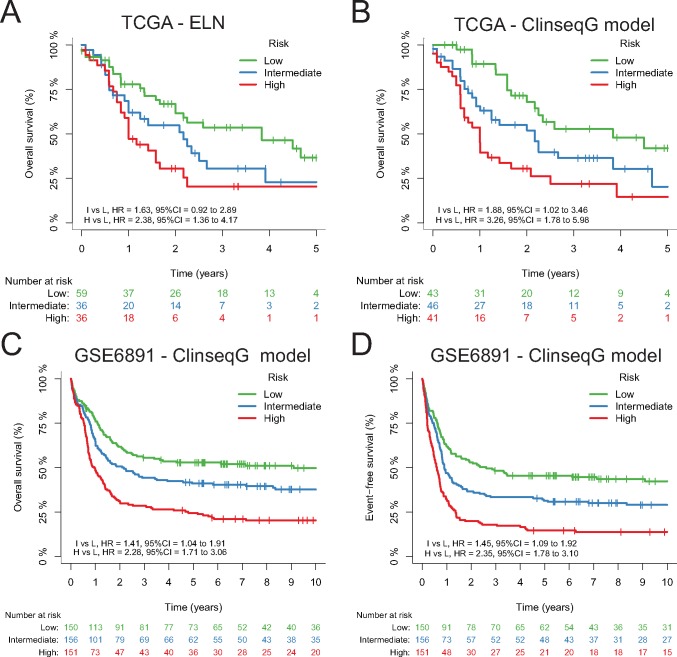
Figure 3.
Kaplan-Meier curves of overall survival (OS) and/or event-free survival (EFS) in The Cancer Genome Atlas and GSE6891 data sets. A) Kaplan-Meier curves of OS by the European LeukemiaNet risk groups in The Cancer Genome Atlas (TCGA) cohort. B) Kaplan-Meier curves of OS by the Clinseq-G model risk groups in the TCGA cohort. C and D) Kaplan-Meier curves of OS and EFS by the Clinseq-G model risk groups in the GSE6891 data set. CI = confidence interval; ELN = European LeukemiaNet; HR = hazard ratio; TCGA = The Cancer Genome Atlas.

