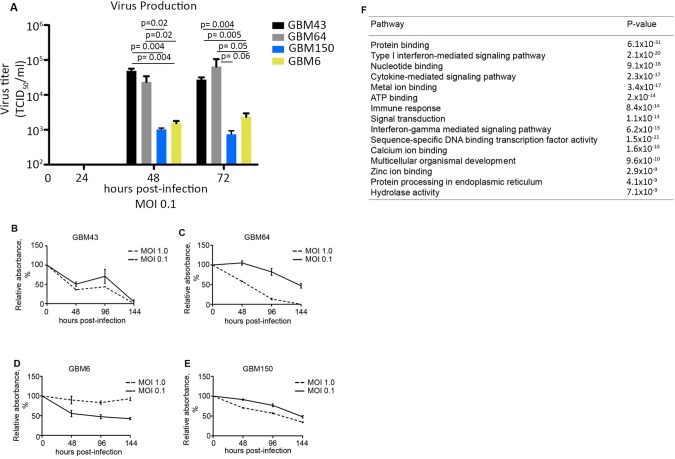
Figure 2.
Gene-set enrichment analysis (GSEA) identifies important interferon-stimulated genes differentially expressed between measles virus (MV)–resistant and permissive glioblastoma (GBM) lines. A) Additional primary GBM lines were infected with MV at a multiplicity of infection (MOI) of 0.1, and virus production was measured by titration on Vero cells 24–72 hours postinfection. B–E) Cell viability was measured by MTT assay in GBM64 and GBM43 cells following infection with MV-NIS (MOI = 1.0 and 0.1; n = 3). F) Gene expression for GBM64, GBM43, GBM150, and GBM6 cells was measured by RNA-Seq. Cells were grouped according to their response to MV. The resistant group consists of GBM39, GBM6, and GBM150, while the permissive group consists of GBM43 and GBM64. GSEA was performed on the MV-resistant and -permissive groups to identify pathways differentially activated between the two groups (expression of 19 835 genes was included in the analysis). The top 15 pathways overrepresented in the resistant group are listed; 2.14 × 10⁻²⁰). In vitro experiments were repeated two or more times. A two-sided Student t test was used to determine statistically significant differences. Data are presented as the mean and SD (A–E). GBM = glioblastoma; MOI = multiplicity of infection.

