Figure 3.
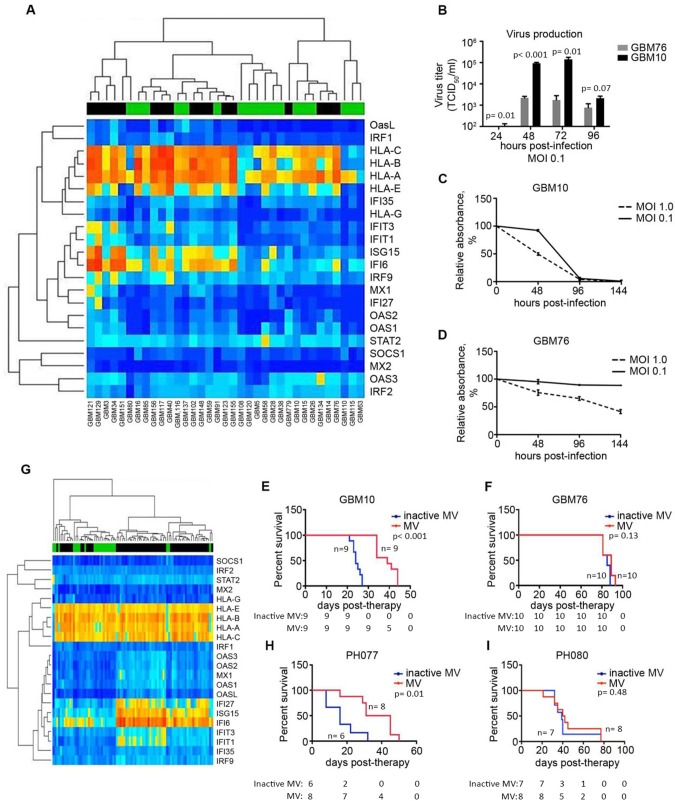
Application of the diagonal linear discriminant analysis (DLDA) algorithm in primary glioblastoma (GBM) and ovarian cancer (OvCa) xenografts. A) Expression of the 22-gene signature was analyzed and illustrated in a heat map consisting of 35 primary GBM lines (predicted responders and nonresponders are indicated by a green or black bar, respectively). B) Representative lines classified as permissive (GBM10) or resistant (GBM76), based on the DLDA analysis, were infected with MV-NIS (multiplicity of infection [MOI] = 0.1), and virus production was measured by titration on Vero cells 24–96 hours postinfection (n = 3). C and D) GBM10 and GBM76 cells were infected with MV-NIS (MOI = 1.0 and 0.1), and cell viability was measured by MTT assay (n = 3). E and F) Athymic nude mice were implanted orthotopically with either GBM10 or GBM76 cells. Mice were treated with MV-NIS (1 × 10⁵ TCID50/mL) once every three days for a total of three (GBM10) or five (GBM76) doses. G) The DLDA scoring algorithm was applied in gene expression data obtained from primary patient-derived OvCa tumors passaged in mice. H) Low interferon-stimulated gene (ISG)–expressing OvCa line, PH077, and (I) a high-ISG expressing line, PH080, were implanted intraperitoneally in SCID beige mice. In vitro experiments were repeated two or more times. A two-sided Student t test was used to determine statistically significant differences. Kaplan-Meier survival curves and log-rank tests were used to obtain median survival times and compare survival between animal groups. Data are presented as the mean and SD (B–D). GBM = glioblastoma; MOI = multiplicity of infection; MV = measles virus.

