Figure 4.
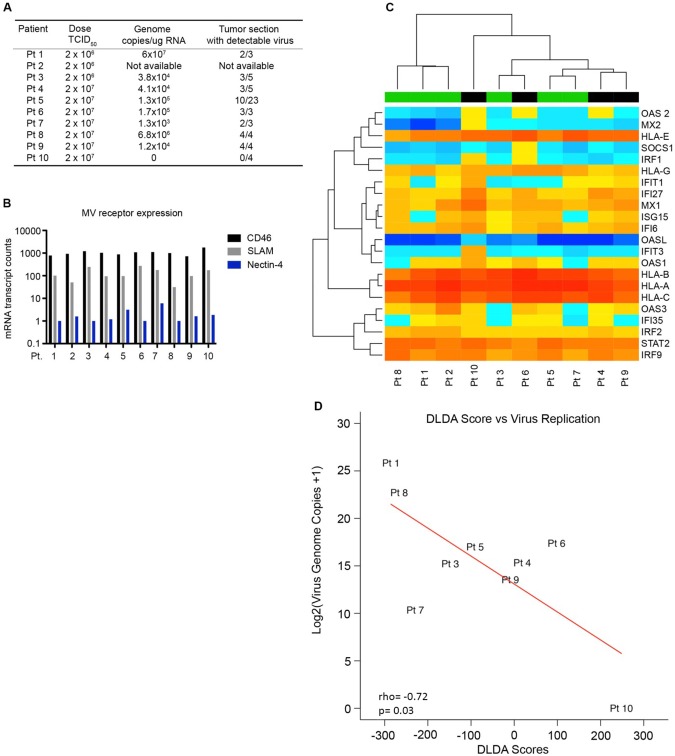
Expression of the interferon gene signature in MV-treated GBM patients. A) GBM patients were treated with MV-CEA (2 × 10⁶ patients 1–3 or 2 × 10⁷ TCID50 for patients 4–10) on day 0, and tumors were resected on day 5. RNA was extracted from multiple regions of the treated tumors, and virus replication was assessed by quantitative real-time polymerase chain reaction for viral genome copies. B) RNA was extracted from the primary tumors of GBM patients scheduled to receive MV therapy in an ongoing phase I trial. Gene expression was assessed by Nanostring analysis using a custom gene panel that assessed the interferon-stimulated gene (ISG) profile and virus entry receptor expression. C) Expression of the 22 ISG panel is depicted in the heat map. The diagonal linear discriminant analysis (DLDA) scoring system was applied to the patients, and classification was assigned to each individual patient (black bar = resistant, green bar = permissive). D) DLDA scores calculated for each patient were assessed for correlation to virus replication measured from the treated tumors. Pearson coefficients were utilized to evaluate the correlation between virus replication and DLDA scores. DLDA = diagonal linear discriminant analysis; MV = measles virus.

