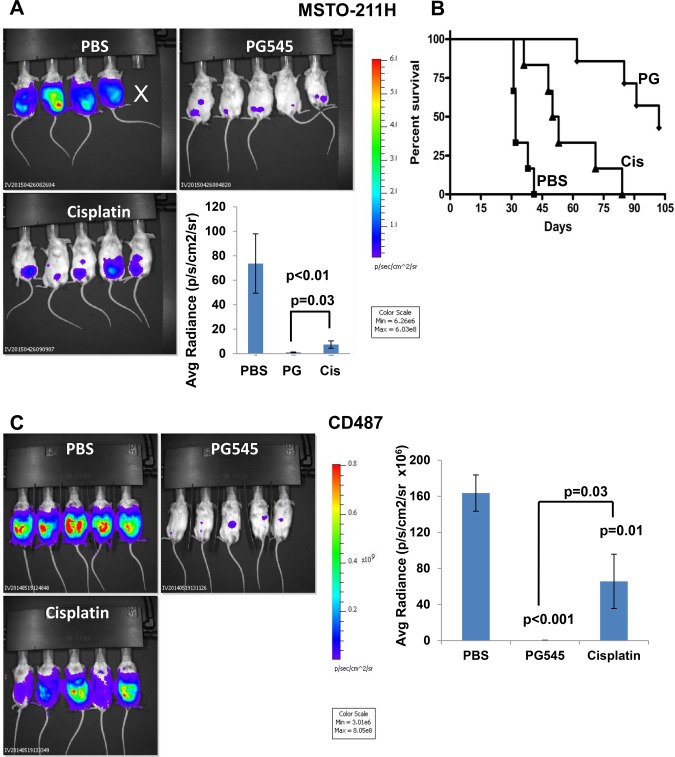
Figure 4.
Effect of PG545 on orthotopic mesothelioma model. A) Tumor growth. Luciferase-labeled MSTO-211H human mesothelioma cells (2 × 10⁶) were inoculated i.p. into NOD/SCID mice (n = 6/treatment). Mice were treated with PG545 (400 μg/mouse; once a week), cisplatin (once every two weeks; 3 mg/kg), or control vehicle (PBS), and tumor development was inspected by IVIS. Quantification of the luciferase intensities is shown graphically in the lower right panel (mean ±SD; P = .006 for PG545 vs PBS; P = .008 for cisplatin vs PBS, and P = .03 for PG545 vs cisplatin; two-sided analysis of variance and the Mann-Whitney U test were used for statistical analysis). B) Survival. The effect of PG545 and cisplatin on the survival of mice (n = 7) is plotted as Kaplan-Meier curves (P < .001, .003, and .001 for PG545 vs PBS, cisplatin vs PBS, and PG545 vs cisplatin, respectively). The number at risk for the PBS, PG545 and Cisplatin treated mice were: 6, 7 & 6 at baseline; 6, 7 & 5 up to day 41; 0, 7 & 2 from day 42 to 53; and 0, 3 & 0 beyond day 54, respectively. C) Luciferase-labeled CD487 human mesothelioma cells (2 × 10⁶) were inoculated i.p. into 18 NOD/SCID mice. Groups of six mice were treated with PG545 (400 µg/mouse; once a week), cisplatin (3 mg/kg; once every two weeks), or control vehicle (PBS), and tumor development was inspected by IVIS (representative images are shown). Quantification of the luciferase intensities is shown graphically in the right panel (mean ±SD; P ≤ .03; two-sided analysis of variance and the Mann-Whitney U test were used for statistical analysis).

