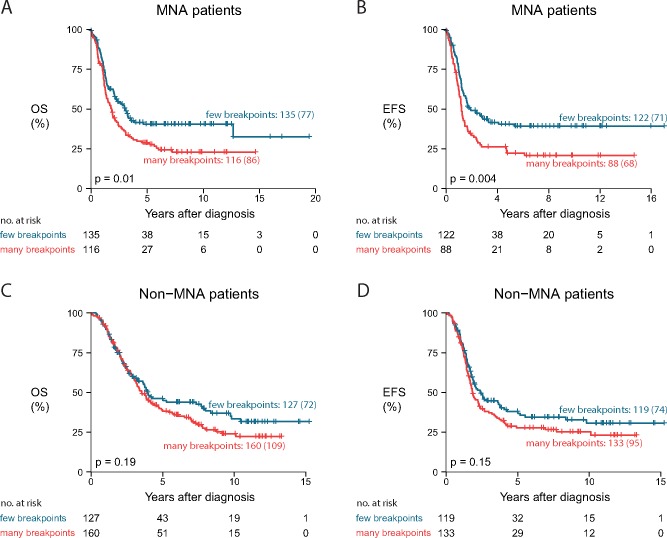
Figure 2.
Impact of number of breakpoints on patient survival. Comparison of overall survival (A and C) and event-free survival (B and D) of cases with many breakpoints (9–61, above or equal to median) vs cases with a lower number of breakpoints (2–8, below median), within both the subgroup of MYCN-amplified cases (A and B) and the subgroup of MYCN-nonamplified cases (C and D). P values represent two-sided log-rank tests. Curve labels represent the number of samples with the number of events between brackets. EFS = event-free survival; MNA = MYCN-amplified; non-MNA = MYCN-nonamplified; OS = overall survival.

