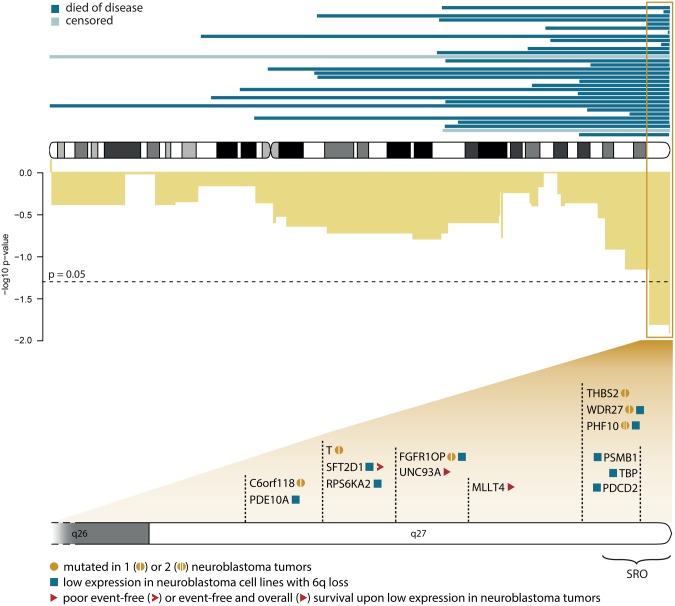
Figure 5.
Detailed view of distal 6q losses. Top: Exact location of the distal 6q deletions found in 32 patients (all cohorts). Censored patients are indicated with a lighter shade. Middle: -log10 of P values (uncorrected) of Cox regression for chromosome 6 in the training set (cohort 1 + 2). Bottom: Genes in the statistically significant region (based on Cox regression) that met at least one of the following criteria: statistically significantly lower expression of the gene in neuroblastoma cell lines with vs without a 6q deletion (squares), at least one mutation in the gene as described in primary tumors (circles), and statistically significantly worse survival outcome when gene expression is low (lowest 10th percentile) in high-risk neuroblastoma tumors (triangles). SRO = smallest region of overlap.

