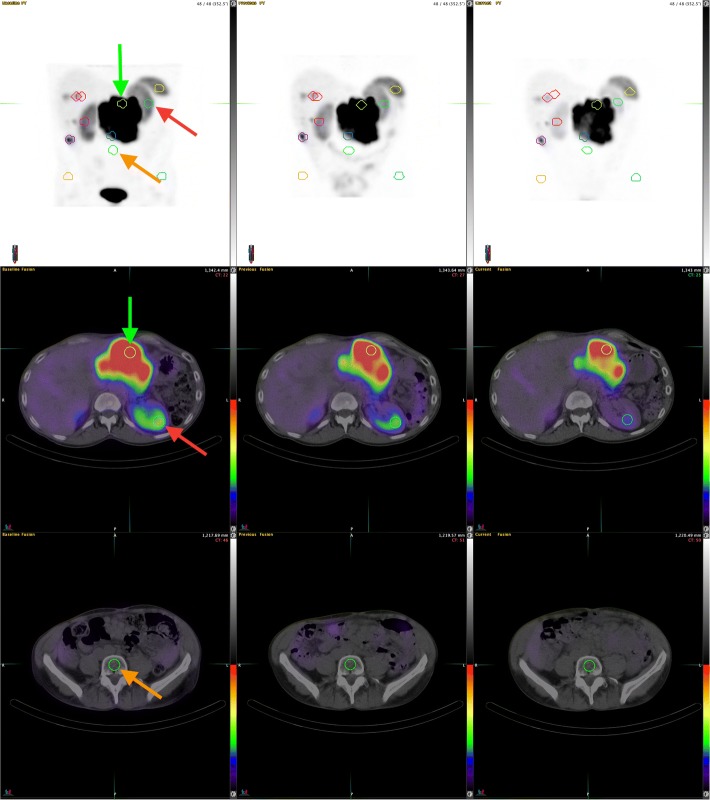
Fig. 1.
Post-treatment serial QSPECT/CT was performed at (from left to right) 5, 24, and 70 h after a 22.0 GBq 177Lu-octreotate administration in a 55-year-old male with metastatic NET of unknown origin. Small volumes of interest (2-cm diameter) were placed over tissues of interest. Left kidney (red arrows), L5 bone marrow cavity (orange arrows), and dominant tumor (green arrows) VOIs are pointed on anterior maximum intensity projections (top row) and selected transaxial fusion slices (mid and bottom rows). QSPECT images are normalized using an upper SUV threshold of 7. During this consolidation cycle, the personalized injected activity allowed the delivery of 6.1 Gy (6.0 Gy prescribed) to the kidney

