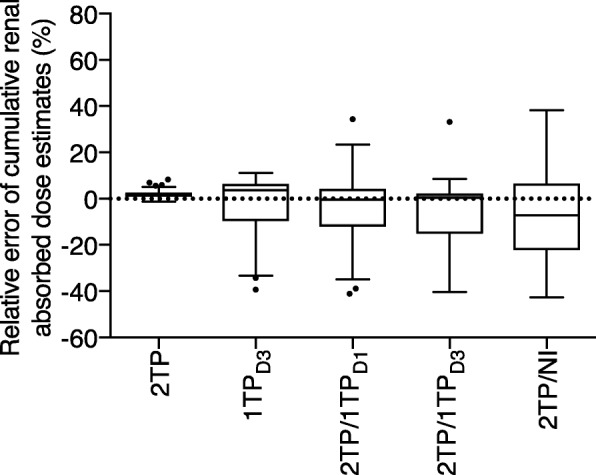
Fig. 4.

Comparison of the relative errors of per-induction course cumulative renal absorbed dose estimates obtained by the simplified methods relative to the three-time-point (3TP) method. Boxes represent the interquartile range, and whiskers the interdecile range (n = 65)
