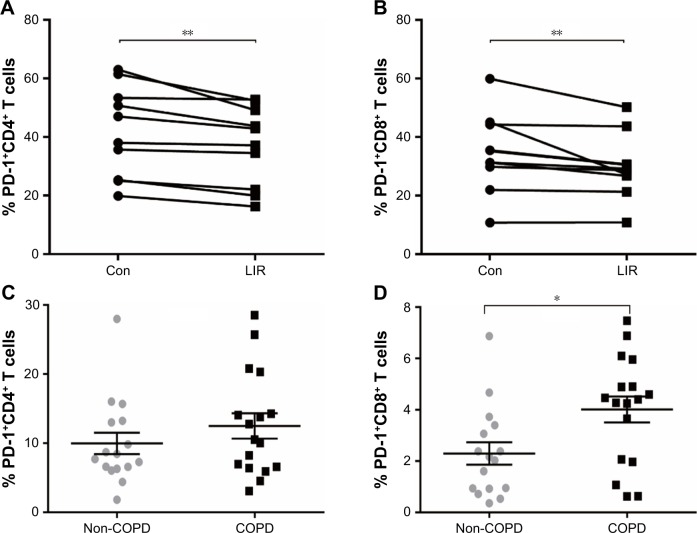
Figure 5.
PD-1 expression of T cells in COPD patients.
Notes: (A, B) Frequency of PD-1 expression on CD4 T cells and CD8 T cells measured by flow cytometry from COPD with or without LIR treatment overnight (n=10). Each line represents a result from an individual COPD patient. **P<0.01 vs control. The statistical significance of differences observed was determined by Wilcoxon matched-pairs signed-rank test. (C, D) Frequency of PD-1 expression on CD4 T cells and CD8 T cells measured by flow cytometry at baseline from COPD patients (n=17) and non-COPD subjects (n=16). Data are * expressed as mean ± SEM. *P<0.05 vs non-COPD subjects. The statistical significance of differences observed was determined by the Mann–Whitney test.
Abbreviations: con, control; LIR, liraglutide; PD-1, programmed cell death protein 1; SEM, standard error of the mean.

