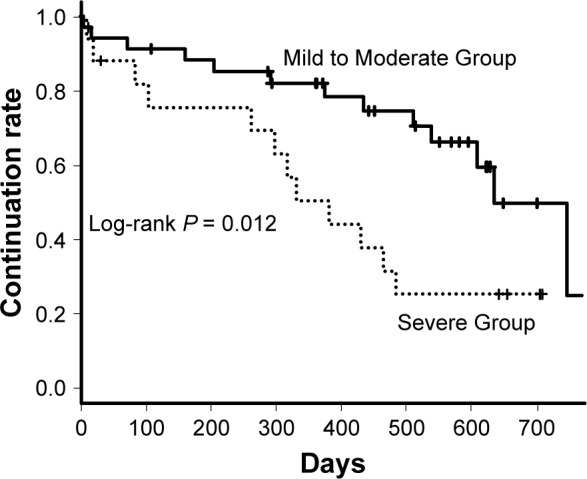
Figure 4.

Nintedanib continuable curves of Mild to Moderate and Severe patients.
Note: A log-rank test revealed that there was significant difference in the continuation rate between two groups (P = 0.012).

Nintedanib continuable curves of Mild to Moderate and Severe patients.
Note: A log-rank test revealed that there was significant difference in the continuation rate between two groups (P = 0.012).