FIGURE 2.

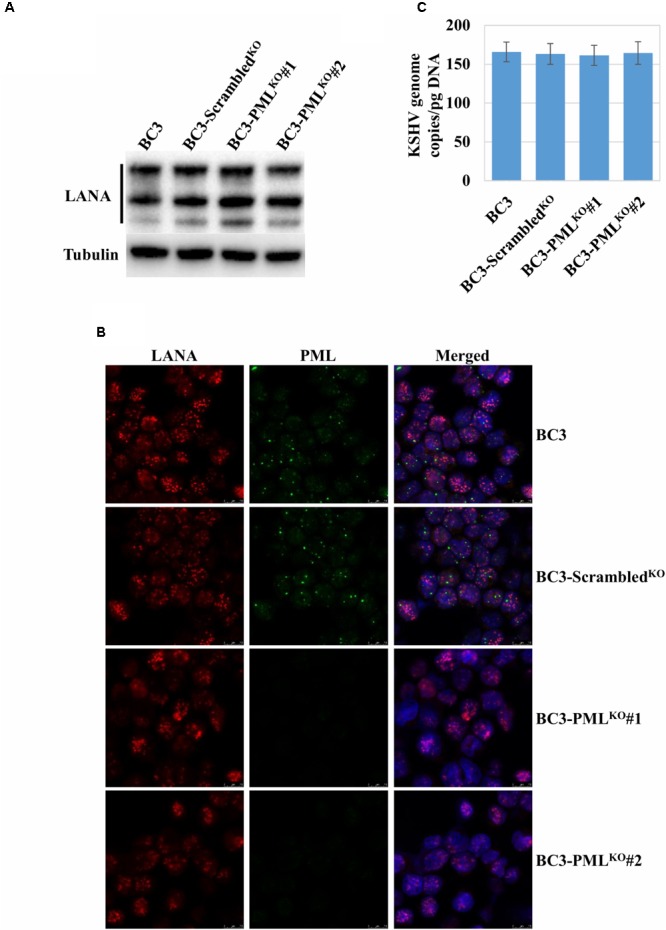
Analysis of LANA expression and KSHV episomes in the PML-knockout cells. (A) Immunoblot analysis of LANA. Total proteins were extracted from the wild-type (BC3), the control (BC3-ScrambledKO), and the stable PML-knockout cells (BC3-PMLKO#1 and BC3-PMLKO#2). The proteins separated on an SDS–PAGE were immunoblotted with a LANA antibody. These samples were the same as those shown Figure 1A and thus, the β-tubulin as a loading control for each lane was also the same as one in Figure 1A. (B) Immunofluorescence analysis of LANA and PML. The cells were stained with a rat anti-LANA and a mouse anti-PML antibody followed by Alexa Fluor® 546 and Alexa Fluor® 488 conjugated anti-rat IgG (red) and anti-mouse IgG (green), respectively. The cell nuclei were stained with DAPI and shown in blue. (C) KSHV episome copy number quantification. Total DNA from the cells was extracted and the KSHV episome copy number was quantified by qPCR with a KSHV gene-specific primer set and the data were shown KSHV genome copy/ pg DNA. The results are presented as an average of three replicates with error bars representing SEs.
