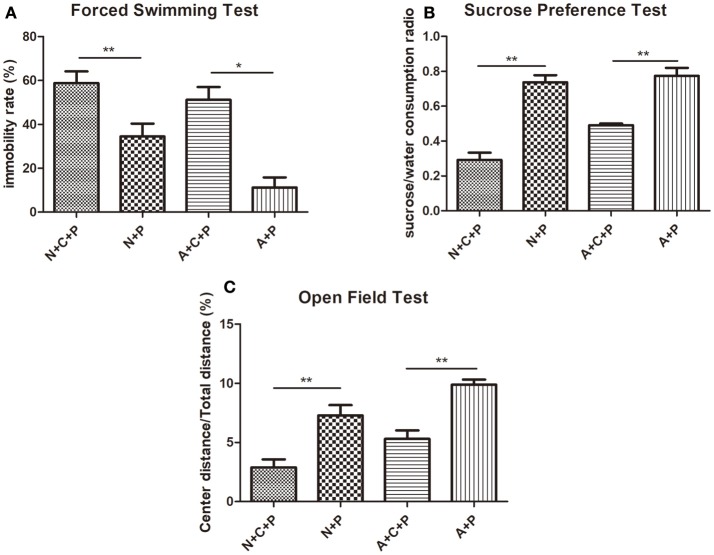
Figure 3.
CUMS-induced depression-like behaviors. (A) Immobility rate of N+C+P, N+P, A+C+P, and A+P groups in FST. (B) Sucrose/water consumption ratio of N+C+P, N+P, A+C+P, and A+P groups in SPT. (C) Center distance/total distance ratio of N+C+P, N+P, A+C+P, and A+P groups in open field test (OFT). Values are expressed as mean ± SEM (n = 5). N+C+P vs. N+P, *P < 0.05, **P < 0.01; A+C+P vs. A+P, *P < 0.05, **P < 0.01.

