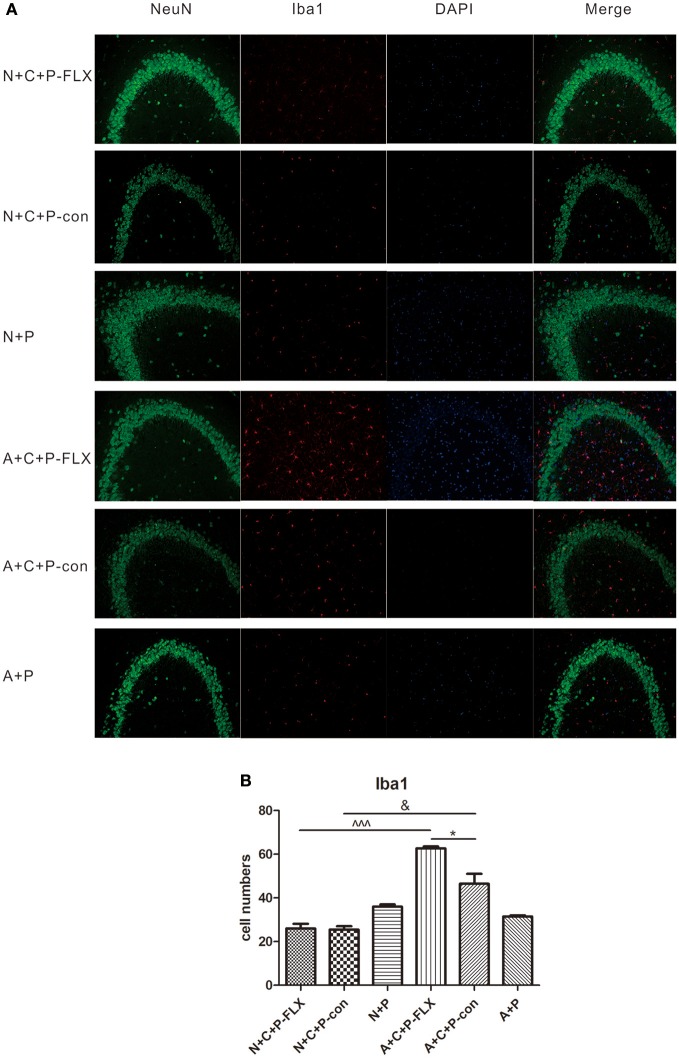
Figure 7.
Immunofluorescence results indicated variation of microglia activation after CUMS and fluoxetine treatment. (A) Representative images of Iba1 (red), NeuN (green), and DAPI (blue). Merged images are shown in the right panel. Bar = 50 μm. (B) Quantification analysis of Iba1-positive cells. Values are expressed as mean ± SEM (n > 5). N+C+P-con vs. A+C+P-con, &P < 0.01; N+C+P-FLX vs. A+C+P-FLX, ∧∧∧P < 0.001, A+C+P-FLX vs. A+C+P-con, *P < 0.05.

