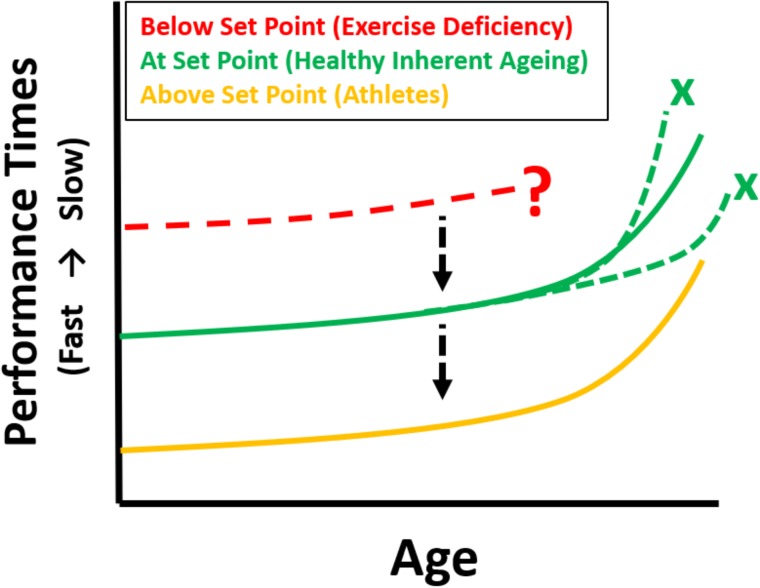
FIGURE 1.
Theoretical longitudinal maximum performance curves (e.g., swimming, running, cycling) for athletes as they age [based on cross-sectional data from World Record performances, Baker and Tang (2010), gold]. Inherently aging individuals exercising at Set Point (green) are predicted to have the same trajectory of decline if they were to undertake a similar athletic event at regular intervals as they age (depicting the change in integrative whole-body physiology due to aging), but with inferior performances. Maintaining the same profile, but improving athletic performance is possible by increasing exercise towards the gold zone. Those below set point show an unpredictable trajectory (red). The black arrows indicate the change to different performance curves with increased levels of physical exercise, the green crosses indicate that if exercising at set point there can be no acceleration or deceleration (i.e., deviation from the predicted curve which represents inherent aging) – assuming no disease. The red dotted curve and question mark indicate both an uncertain trajectory, or indeed the very possibility, of being able to undertake a maximal performance.

