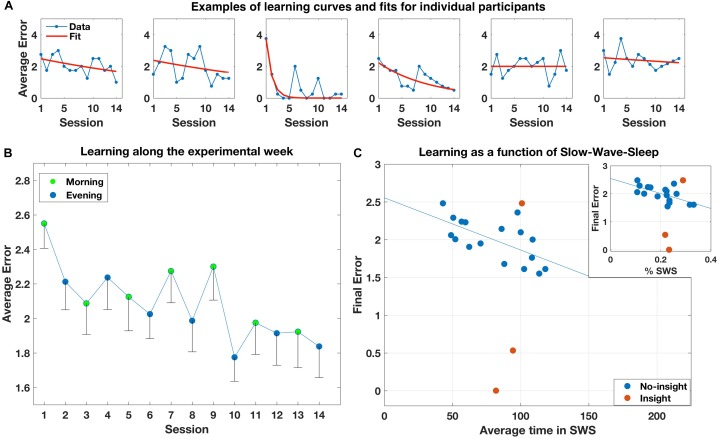
FIGURE 2.
(A) Examples of individual learning curves and exponential fits of six participants, representing different learning abilities (moderate learning without insight into the maps structure; learning with insight; little or no learning). (B) Average error rates across participants along the experimental sessions. Error bars represent standard deviation of the mean. (C) Final error rates at the end of learning for all participants as a function of their individual average time in SWS. Blue dots represent participants that did not gain insight into the maps’ structure. Brown dots represent participants that gained insight. Inset: Same, for average individual proportion of SWS out of total sleep time.

