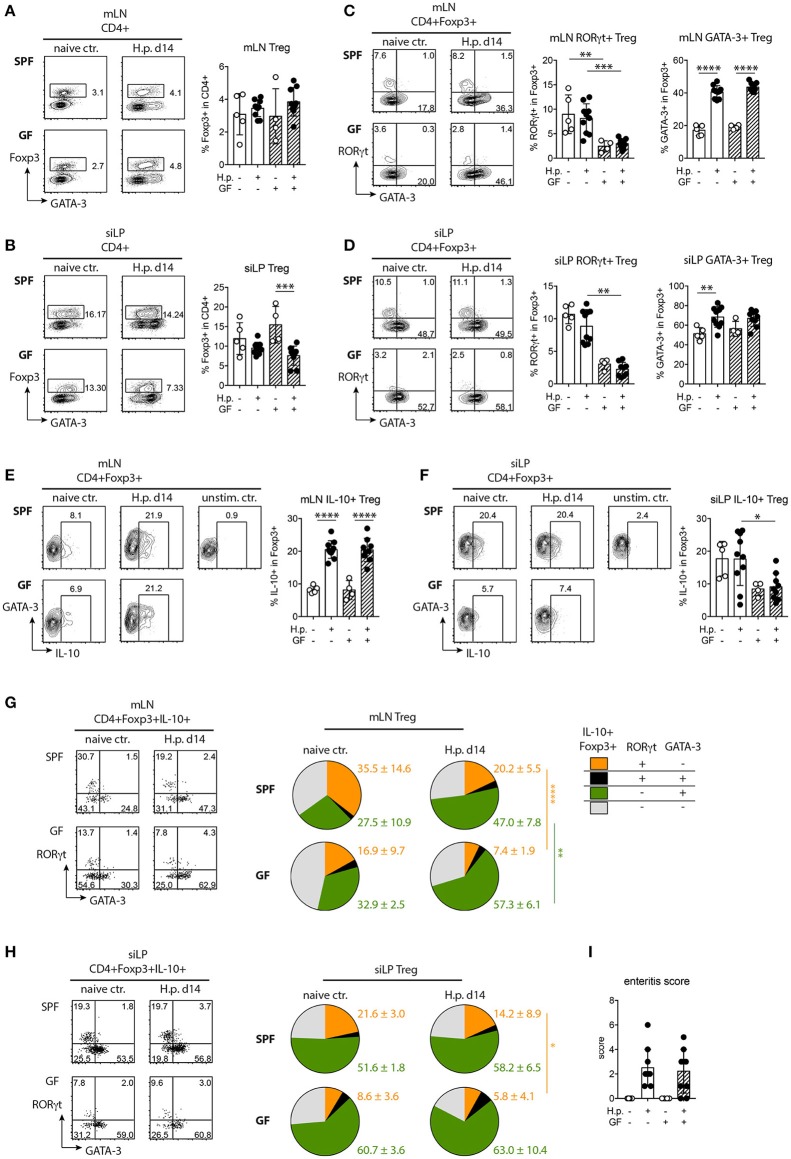
Figure 4.
Treg responses in SPF and GF mice infected with H. polygyrus. (A,B) Representative plots of Foxp3+ Treg detection in CD4+ T cells and Treg frequencies in mesenteric lymph nodes (mLN, A) and small intestinal lamina propria (siLP, B) of uninfected controls and mice infected with H. polygyrus for 2 weeks. (C,D) Representative plots of RORγt and GATA-3 expression by Treg and frequencies of RORγt+ and GATA-3+ Treg in mLN (C) and siLP (D). (E,F) Representative plots of IL-10 expression and frequencies of IL-10+ Treg in mLN (E) and siLP (F). (G,H) Representation of RORγt+, RORγt+GATA-3+, GATA-3+, and RORγt−GATA-3− Treg in the IL-10+ Treg population in mLN and siLP of naïve and infected mice. Numbers express group means and SD. (I) Duodenal enteritis scores. Data are pooled from two independent experiments each performed with two to three uninfected and four to five infected mice per group. Mean, SD, and individual data points are shown in (A–H). *p < 0.05; **p < 0.01, ***p < 0.001, ****p < 0.0001.

