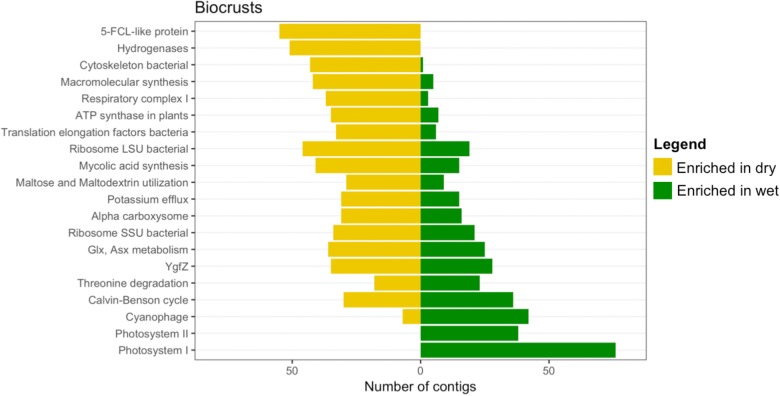
FIGURE 9.
Differentially abundant subsystems due to wetting in surface soil samples. The level 2 SEED annotations were used to functionally bin the contigs identified as differentially abundant (Figure 8), of which the 20 most abundant (sorted by the total number of contigs in each bin) are displayed. A full list of differentially abundant contigs in the biocrusts is listed in Supplementary Table S1 (only annotated contigs are presented). For the trampled surface samples, no contigs were identified as significantly enriched in the wetted samples (Figure 8) and of the 27 significantly enriched in the dry samples only four were annotated to SEED subsystems, so the data is not shown. All four subsystems were in the category Hydrogenases. A full list of differentially abundant contigs in the trampled surface soils is listed in Supplementary Table S2.

