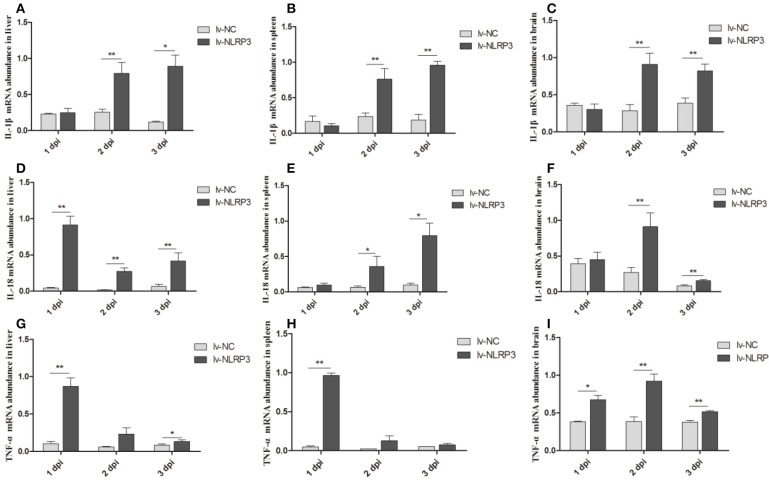
Figure 4.
Expression profiles of inflammatory cytokines in lentiviral vector-APEC infected ducks tissues. The mRNA expression abundance of IL-1β in liver (A), spleen (B), brain (C), IL-18 in liver (D), spleen (E), brain (F), and TNF-α in liver (G), spleen (H), brain (I) from the NC-lentiviral vector and NLRP3-lentiviral vector infected ducks post-infection with APEC. The samples of NLRP3-lentiviral vector infected and NC-lentiviral vector-infected ducks were collected at 1, 2, and 3 dpi. And all these mRNA fold changes were calculated using the NLRP3-lentiviral vector-infected ducks vs. NC-lentiviral vector infected ducks at the same time point. The fold change was calculated by the 2−ΔCt method and expressed as the means ± SD (n = 3), and the student's t test was performed to evaluate the differences. *Significant difference (P < 0.05); **highly significant difference (P < 0.01); dpi, days post-infection.

