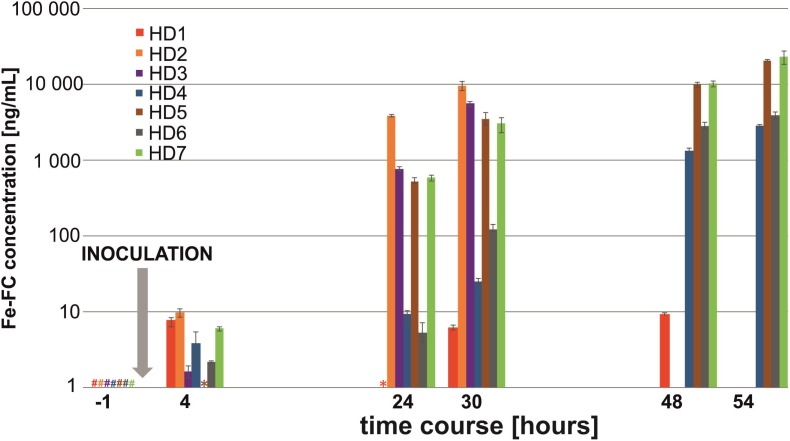
FIGURE 1.
Infection diagram indicating the progression of aspergillosis in the HD rat model with seven biological replicates. Fe-FC concentration detected in rat urine is plotted on a logarithmic scale. A hash (#) denotes the Fe-FC concentration below limit of detection, while an asterisk (∗) denotes the Fe-FC concentration below limit of quantification. Missing bars at 48–54 h post-infection indicate animal death.

