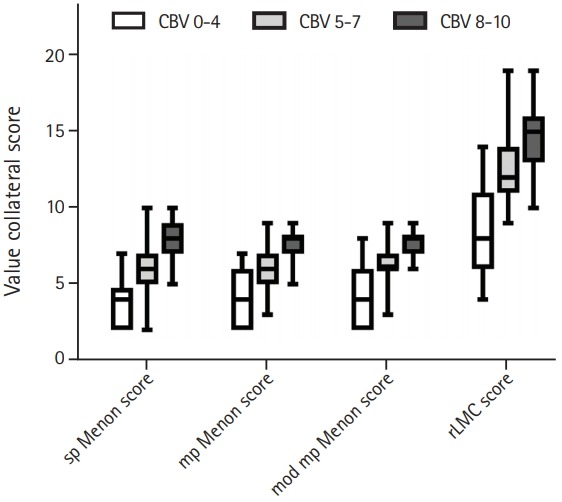
Figure 2.

Boxplots of collateral scores stratified by cerebral blood volume (CBV) groups are shown. Patients were trichotomized in three groups ac - cording to their CBV-Alberta Stroke Program Early CT Score (ASPECTS) grades (0 to 4, shown in white; 5 to 7, shown in light grey; and 8 to 10, shown in dark grey) reflecting severity of perfusion deficits and the collat - eral scores were compared between these groups. A P<0.01 for all compar - isons. sp Menon score, single-phase Menon score; mp Menon score, mul - ti-phase Menon score; mod mp Menon score, modified multi-phase Menon score; rLMC score, regional leptomeningeal collateral score.
