Figure 2.

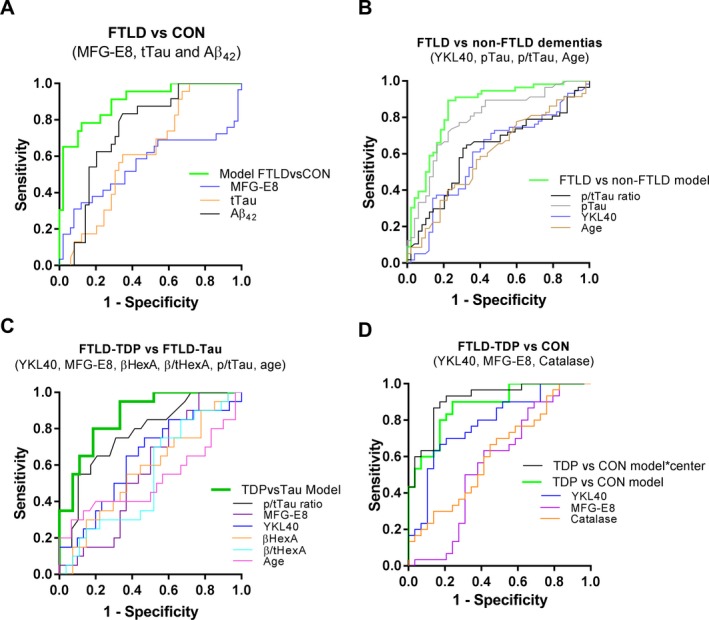
Receiver operating curves (ROC) of the different models discriminating specific diagnostic groups in the discovery cohort. (A) ROC curves of the individual markers or the corresponding biomarker combination (MFG‐E8, tTau, and Aβ 42) discriminating FTLD from CON. (B) ROC curves of the individual markers or the corresponding biomarker combination (YKL40, pTau, p/tTau, and age) discriminating FTLD from non‐FTLD dementia (AD, DLB). (C) ROC curves of the individual markers or the corresponding biomarker combination (YKL40, MFG‐E8, p/tTau ratio, βHexA activity, β/tHexA, and age) discriminating FTLD‐TDP from FTLD‐Tau. (D) ROC curves of the individual markers or the corresponding biomarker combination discriminating FTLD‐TDP from CON (YKL40, MFG‐E8, and catalase activity) with and without center as interaction factor.
