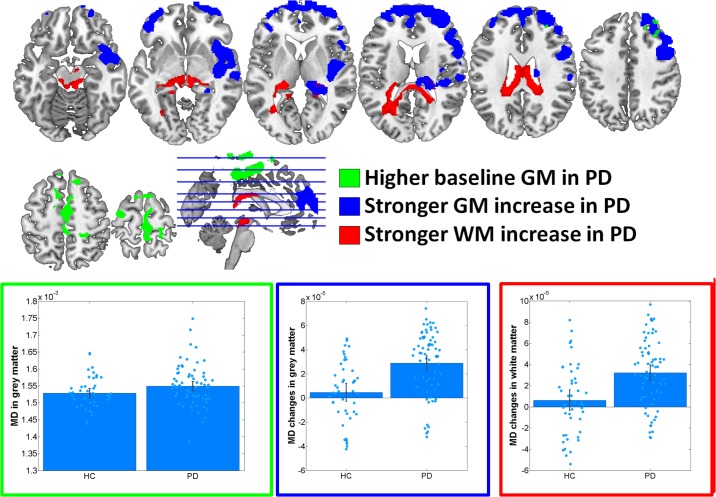
FIGURE 2.
Results of voxel-based morphometry analyses of mean diffusivity (MD) maps. Bar plots show the eigenvariates extracted from the displayed significant clusters. Outline colors of the bar plots correspond to the contrast colors of respective clusters. HC, healthy control participant; PD, Parkinson’s disease patients; GM, gray matter; WM, white matter.

