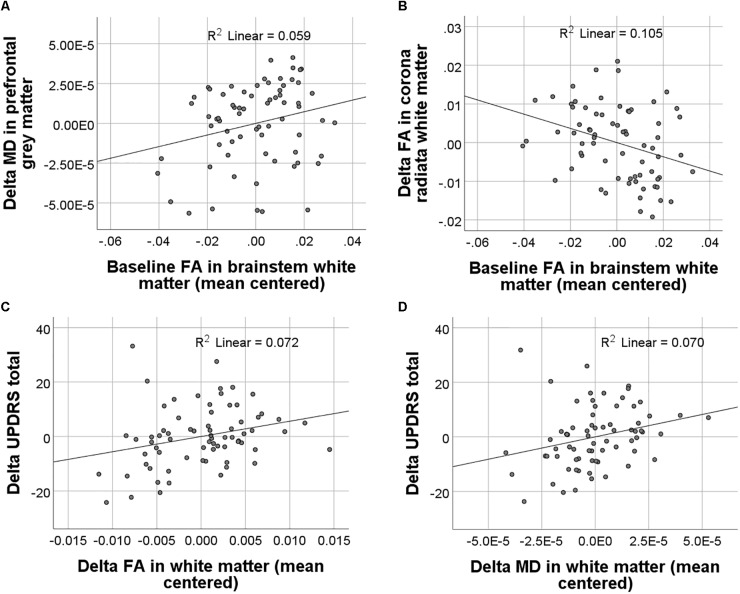
FIGURE 3.
Results of regression analyses between baseline and longitudinal FA and MD values and clinical scores. Significant associations between baseline FA and longitudinal FA and MD changes are displayed in (A) and (B). Significant associations between longitudinal FA and MD changes and changes in symptom severity as measured with the MDS-UPDRS (Movement Disorder Society-sponsored revision of the Unified Parkinson’s Disease Rating Scale) are displayed in (C) and (D).

