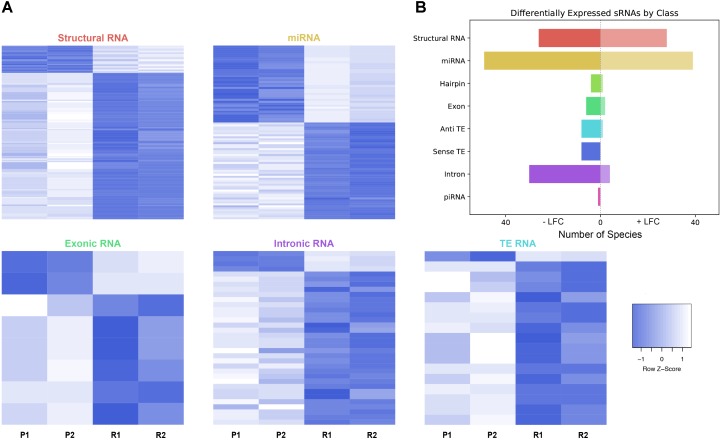
FIGURE 3.
Differential expression analysis of highly abundant sRNAs. (A) Heatmaps depicting all significantly differentially expressed sRNAs per subtype. All heatmaps are row-scaled to lie between –1 and 1, based on the VST normalized count values. P1, P2, R1, and R2 represent 451Lu parental replicates 1 and 2 and 451Lu BRAF Resistant replicates 1 and 2, respectively. (B) Bar plot depicting number of abundant and significantly differentially expressed species with a negative or positive log fold change per subtype. Structural RNA species are collapsed for duplicate tRNAs.

