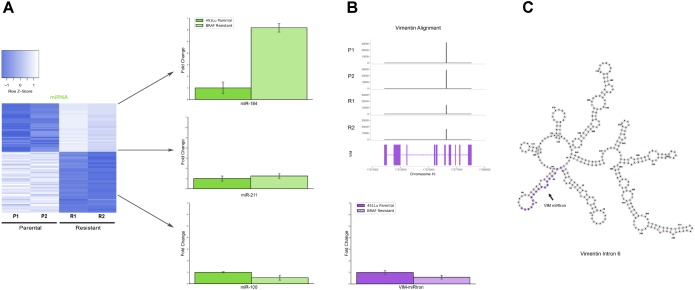
FIGURE 4.
Detailed analysis miRNAs of interest. (A) qPCR representing fold change of miRNAs miR-184, miR-211, and miR-100 in 451Lu BRAF Resistant samples relative to 451Lu parental expression levels across replicates. (B) qPCR representing log fold change of the VIM miRNA in 451Lu BRAF Resistant vs. Parental samples and BAM gene alignment tracks across samples. (C) RNAfold predicted secondary structure of VIM intron 6 with the candidate miRNA highlighted in purple.

