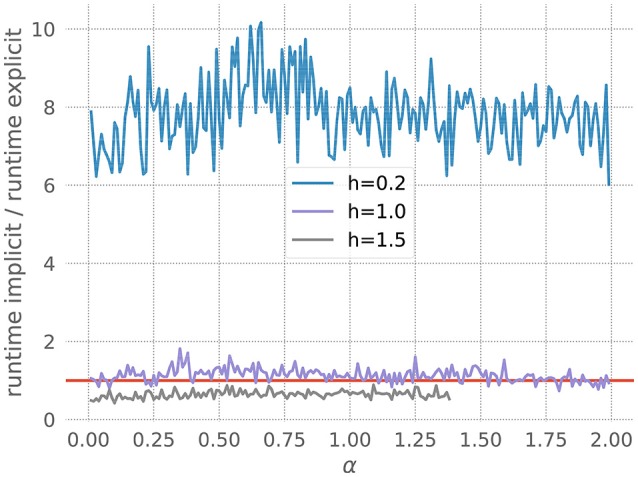
Figure 6.

Application of the stiffness tester to the Morris-Lecar model. Ratio of runtimes for the implicit and explicit method as a function of the factor ε in equation 22, for varying resolution h and a desired accuracy of 10−5. Curves averaged over 5 runs of 20 ms each. Red bar as in Figure 3.
