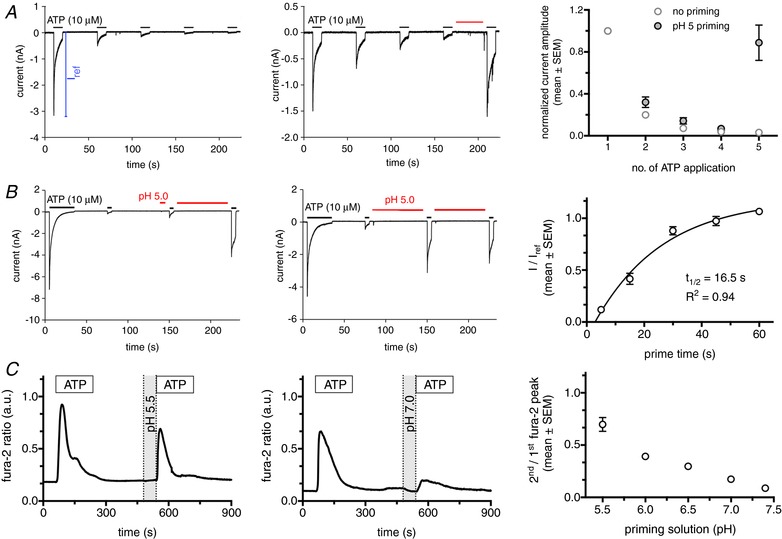
Figure 1. P2X4 receptor current run‐down is reversed by acidic pH.

A, left: whole‐cell patch clamp recordings from a TsA cell expressing (wt)P2X4‐EGFP illustrating receptor current run‐down upon repeated ATP application. Middle: run down of receptor currents upon repeated ATP application was fully abrogated by brief perfusion of cells with acidic bath solution (indicated by red bar). Right: normalized receptor currents from five individual cells following repetitive ATP application (every min) in the absence (no priming) or presence (pH 5 priming) of a 30 s wash with acidic bath solution before the final ATP application. Respective currents were normalized to the peak current measured in any single cell following the initial ATP application (I ref, as illustrated in A). B, left, middle: whole‐cell patch clamp recordings from individual TsA cells expressing (wt)P2X4‐EGFP with varying application times of priming solution (pH 5). Right: normalized receptor currents from eight individual cells following varying priming periods (pH 5). Current amplitudes following the first pH wash (I) were normalized to the peak current following the initial ATP application (I ref). C, left, middle: fura‐2 ratio traces from individual HeLa cells expressing (wt)P2X4‐EGFP. Cells were stimulated with 100 μm ATP for 3 min, followed by a recovery period of 4 min before perfusion with priming solution (1 min) of varying pH and before repeated ATP application. Right: graph depicting ratios of second/first Ca2+ peak following repetitive ATP application (5 min apart) in dependence on the pH of the priming solution before the second ATP application (n > 77 cells for each condition).
