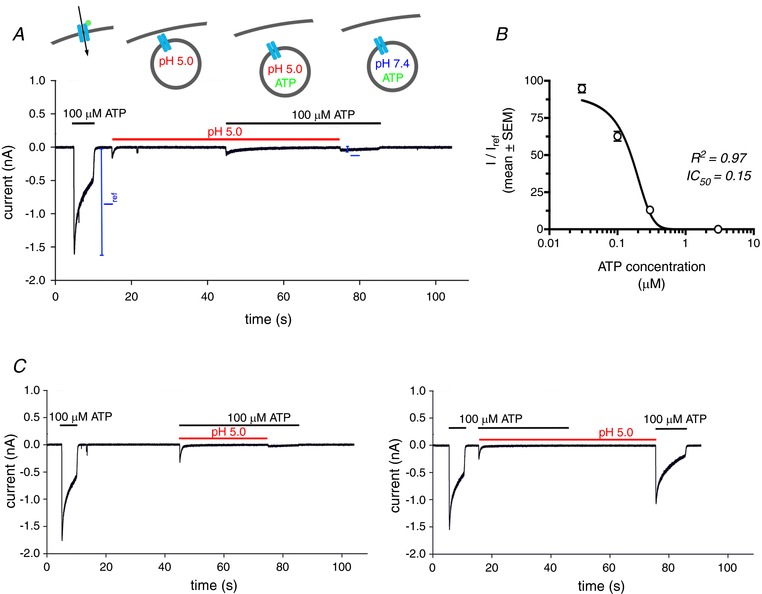
Figure 5. P2X4 re‐sensitization is reduced in the presence of its ligand ATP.

A, whole‐cell patch clamp recording from an individual TsA cell expressing (wt)P2X4‐EGFP. Lines indicate the presence of ATP (black) and/or low pH (red) in the extracellular solution. The depicted experiment mimics activation (100 μm ATP, pH 7.4), internalization/acidification (pH 5.0), residence in acidic compartment containing ATP (100 μm ATP, pH5) and subsequent activation following alkalinization (100 μm ATP, pH 7.4) cycle as depicted in the schematic drawings above the recording. B, normalized receptor currents from 3–6 individual cells depicting the ratio between the peak current following the switch to 100 μm ATP, pH 7.4 as depicted in (A) (I) and the peak current following the initial ATP application (I ref). The inhibitory effect of ATP under acidic conditions had an IC50 = 0.15 μm. C, whole‐cell patch clamp recordings from TsA cells expressing (wt)P2X4‐EGFP. The ATP‐dependent inhibition of P2X4 re‐sensitization (left) could be fully abrogated by brief acidification of the receptor in the absence of ATP (right).
