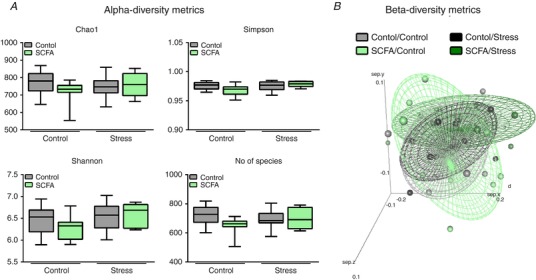
Figure 8. Neither stress nor SCFAs affected caecal microbiota diversity.

A, microbial alpha‐diversity was determined using Chao1, Simpson, Shannon metrics, as well as the number of species detected. B, beta‐diversity of the overall composition was depicted using principle component analysis. Alpha‐diversity metrics were non‐parametrically distributed and analysed using the Kruskal‐Wallis test. Data are depicted as median with IQR and minimum/maximum values as error bars (n = 9–10). [Color figure can be viewed at http://wileyonlinelibrary.com]
