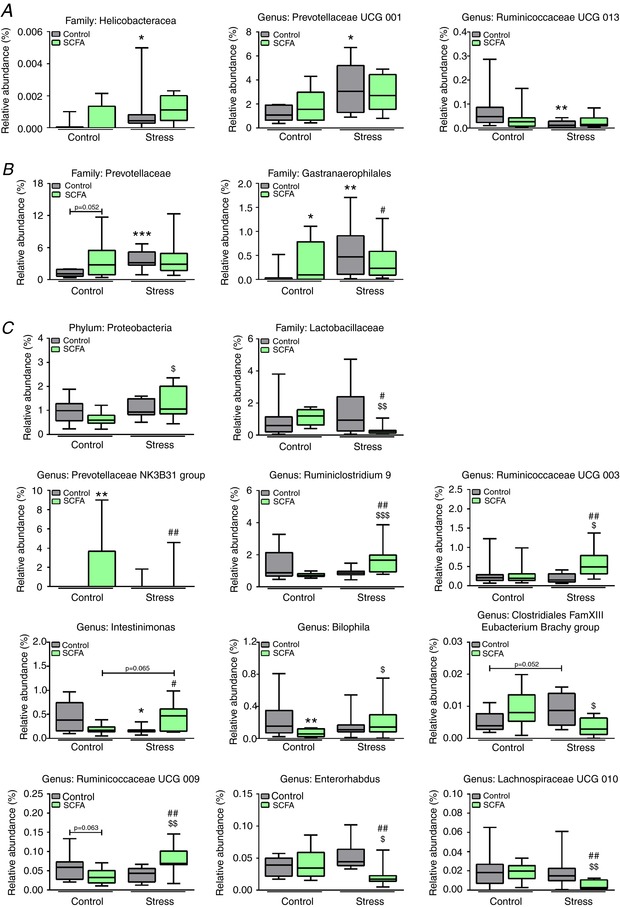
Figure 9. Subtle differences in caecum microbiota at family, genus and phylum levels were detected.

The 16S sequencing revealed few significant differences in microbiota composition on phylum, family and genus level. Data are organised on stress‐effect (A), concurrent SCFA‐ and stress‐effect (B), and combined SCFA and stress effect (C). Data were non‐parametrically distributed and analysed using the Kruskal‐Wallis test, followed by the Mann‐Whitney test. Significant differences are depicted as: * P < 0.05, ** P < 0.01 and *** P < 0.001; Control/Control compared to SCFA/Control or Control/Stress, $ P < 0.05, $$ P < 0.01 and $$$ P < 0.001; SCFA/Control compared to SCFA/Stress, # P < 0.05 and ## P < 0.01; Control/Stress compared to SCFA/Stress. Data are depicted as median with IQR and minimum/maximum values as error bars (n = 9–10). [Color figure can be viewed at http://wileyonlinelibrary.com]
