FIGURE 1.
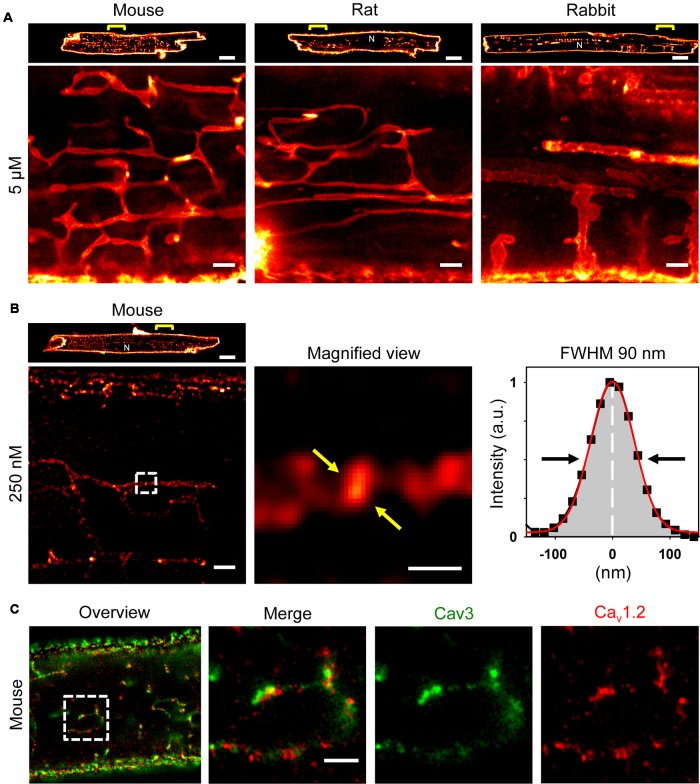
Atrial myocytes from mouse, rat, and rabbit show cell-wide TAT networks composed of abundant axial tubules. (A) Live cell imaging of TAT membranes in isolated AMs using Chol-PEG-KK114 as bulk label (5 μM) for STED nanoscopy. Note, abundant axial tubules (ATs) but sparse transverse tubules (TTs) connected with the lateral surface membrane. Examples are representative for three independent AM isolations from three hearts of each species. Scale bars 10 μm (top row) or 1 μm (bottom row). (B) Here, the Chol-PEG-KK114 marker concentration was reduced 20-fold (250 nM). Note the clearly delimited cholesterol domains visualized live inside TAT membranes of a mouse AM. The signal intensity distribution of one cholesterol domain (black squares indicate individual data points) was fitted by a Gaussian (red curve) to determine the FWHM ∼90 nm (arrows). Scale bars: top 10 μm; bottom: overview 1 μm; magnified view 200 nm. (C) Co-immunofluorescence STED images show Caveolin3 and Cav1.2 clusters in a mouse AM. Scale bar 1 μm. N, nucleus. Yellow brackets and dashed boxes indicate magnified regions.

